Discussion
Pegasystems Inc.
US
Last activity: 21 Oct 2020 3:12 EDT
How to render a total row for a table or repeat dynamic layout
It is very typical to render a row at the bottom of a table that will perform some automatic calculation of each elements in the column and display a total.
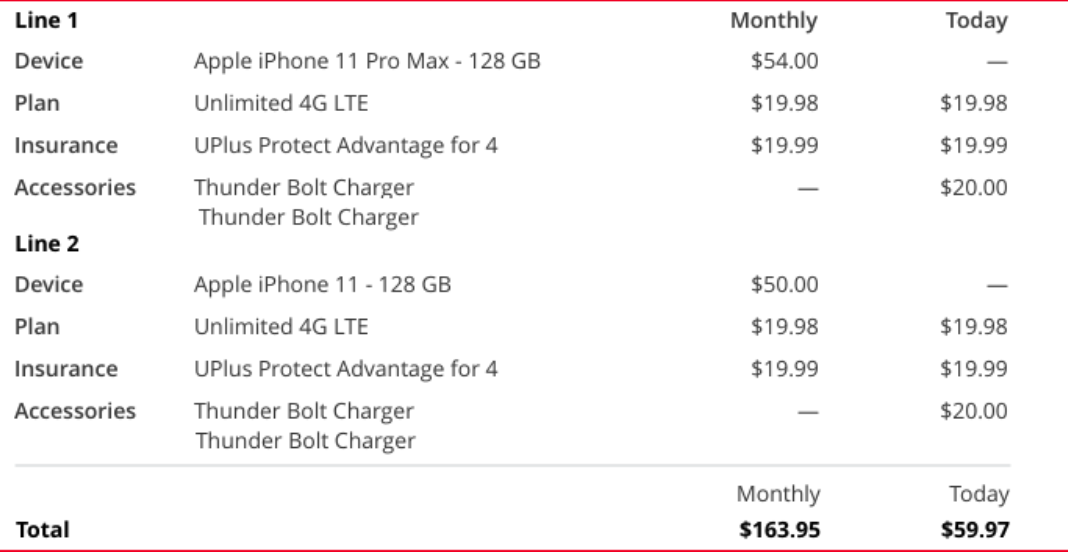
In the example above, we want to categorize the data by 'line' and for each line item render a total cost at the bottom of the table.
Most of the implementation relies on adding some transformation inside the data page to append a new row at the bottom of the page list and to populate it with a total calculation. While this implementation can achieve the design, it pollute the data with an unnecessary row and does not work well when trying to group the data using a certain field.
Let's review a better implementation that will work with optimized and legacy tables as well as table in edit mode and repeat dynamic layout.
Let's assume that we have a DP structure where the data are flattened and present in a page list structure. Grouping by a field is a typical feature of a table that is done by setting the group by feature in the presentation tab of the table
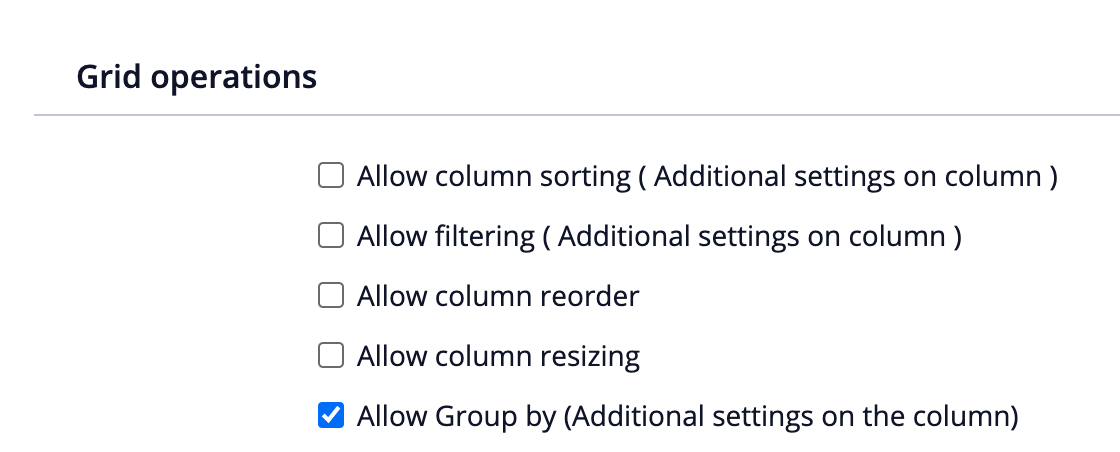
and by setting which column is used for the grouping
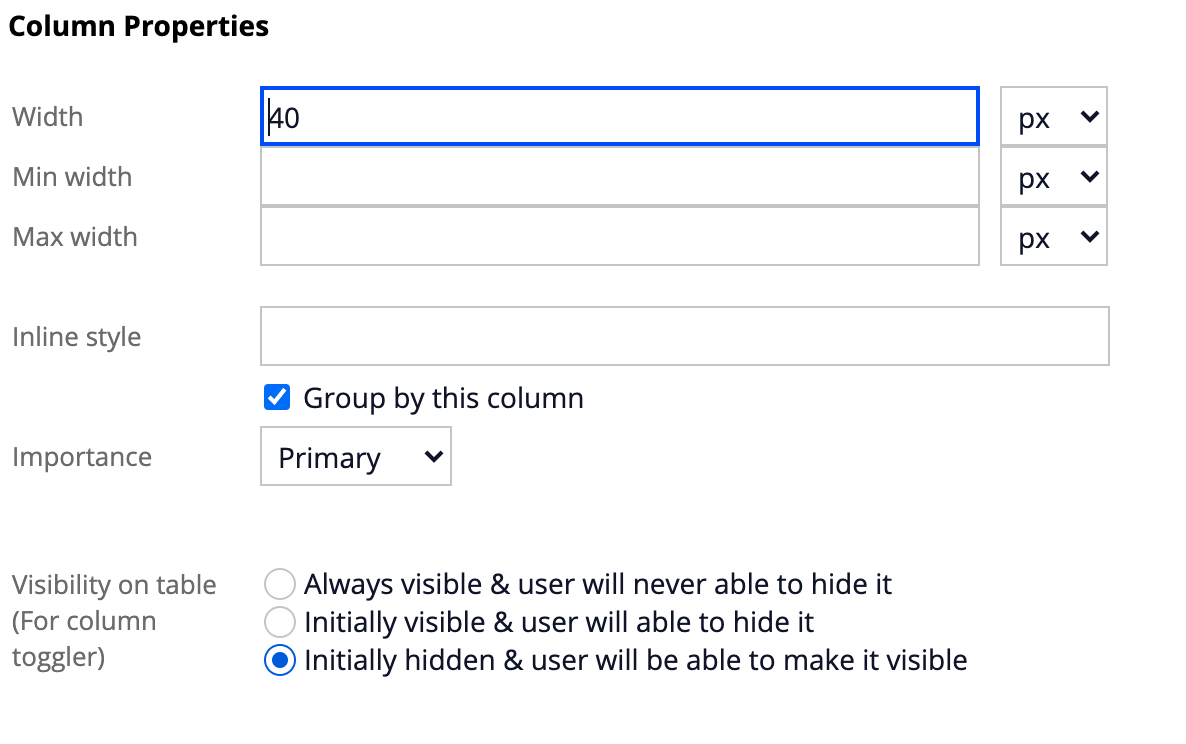
With an RDL, a similar setting is available in the presentation tab- for more details, you can read another article on this topic.
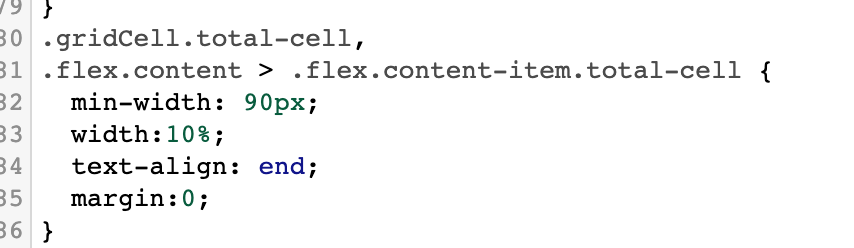
For the total row, the best approach is to create a separate layout where the 2 columns will have a percentage width that will be aligned with the columns of the table. Using the helper class 'total-cell' on these fields as well as on the fields inside the table will help keep them aligned.
With this approach it is possible to render the same view in a table, table with edit mode and RDL. Here is a short video of the functionality - the example is available in the UI gallery in Pega 8.5.2 and higher.