Question
Unitedhealth Group
US
Last activity: 8 Sep 2016 16:41 EDT
How to monitor the health of Pega JVM in 7.1.8
Hi,
We are trying to monitor the health of a Pega JVM in production using third party tools like HP site scope or BSM probe. We have used these tools in past when our application is running on PEGA PRPC 6.2 SP2. Now we upgrade our application to PEGA 7.1.8 and we are no longer able to use the same feature. Below is what we have used to achevie it in PRPC 6.2 SP2.
We have used this URL(http://your_host:your_port/prweb/diagnostic/status_good.gif) from those third party tools to monitor the health of the JVM( they periodically makes a call every 5 minutes) to check if whether the JVM url returns a green check mark image or not. This is not working in PEGA 7.1.8
Can somebody help in fixing it or let me know other ways of acheving this.
***Updated by moderator: Lochan to add Categories***
Pegasystems Inc.
US
Just an FYI. The change in 7 is such that you can no longer directly access the diagnostic directory content.
We are looking for other avenues for a simple PING. (I think that 7.1.9 is the first impementation of the rest service so that is not available as yet)
Pegasystems Inc.
US
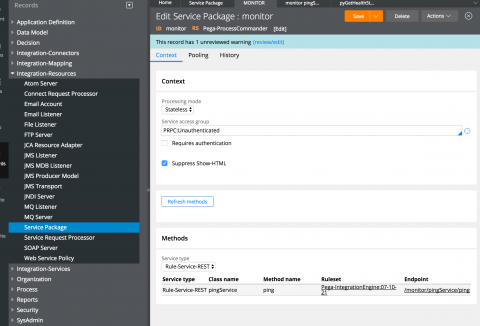
To add more details, the Rest service starting 7.1.9 is called pingService (under monitor service package), see the sceenshot here - you can easily copy the implementation to 7.1.8, it is fairly straightforward.