How to order colors in a report definition or chart control
Hi ,
I have a requirement, My chart should always display resolved status cases which is in red color at bottom of bars in graph and active cases which are shown in grreen should appear at top of bar and so on for various colors.
How to achieve this?
***Updated by moderator: Lochan to add Categories***
Pegasystems Inc.
US
It depends on what specifically you are trying to do. If you are displaying a stacked bar, and want the different statuses of the stack to be different colors, use the "General color settings" in the Chart Editor on the Chart tab of the report definition:

This allows you to define the colors that the chart will use first when displaying the stacked columns. I believe it will use them in the order that they appear in the list you enter, so match that to the order that the statuses appears in the stacked columns (i.e., the order of the legend).
If you are trying to display different columns for specific "group by" values in different columns, use the "Conditional colors" settings in the Chart editor on the report definition:
It depends on what specifically you are trying to do. If you are displaying a stacked bar, and want the different statuses of the stack to be different colors, use the "General color settings" in the Chart Editor on the Chart tab of the report definition:
This allows you to define the colors that the chart will use first when displaying the stacked columns. I believe it will use them in the order that they appear in the list you enter, so match that to the order that the statuses appears in the stacked columns (i.e., the order of the legend).
If you are trying to display different columns for specific "group by" values in different columns, use the "Conditional colors" settings in the Chart editor on the report definition:

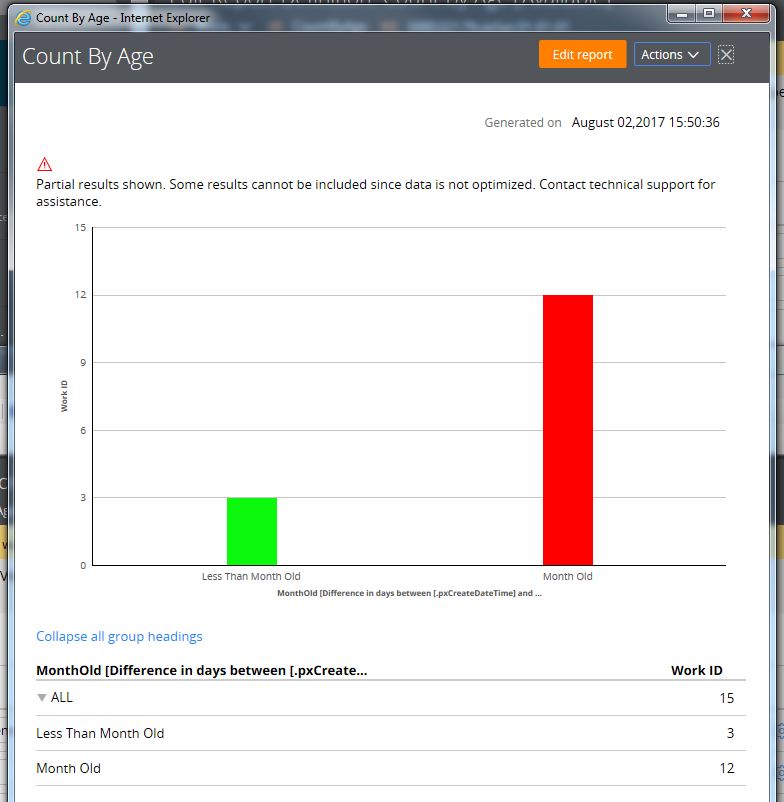
I have an example that shows a count of cases less than a month old in green and a month or more in red:

The report groups by a function alias that returns either "Month Old" or "Less Than Month Old":


When is runs, the columns show in the specified colrs:
Hope this helps!
IN
Hi Ronlee,
Thanks for the reply with clear explanation. Very happpy to see it. How ever my requiremnet is bit different i am stacked bar chart so i display multiple colors on same bar and i always want red color to be at bootm and green to be at top on all bars.
Please suggest.