Question
1
Replies
261
Views
Posted: May 10, 2016
Last activity: August 26, 2020
Closed
Solved
Report chart questions
- For column charts, is it possible to combine chart types?
- For example, can we do a combo clustered-overlaid chart?
- When it comes to the "limit to top” function for the vertical axis, is it possible to auto-adjust the limit so the data fits nicely in the chart?
- For example, if the highest value in the data window is 23 customers, can we cap the y-axis at 30 customers?
- For the “Slider” feature of a chart, what are the properties it can control when displayed?
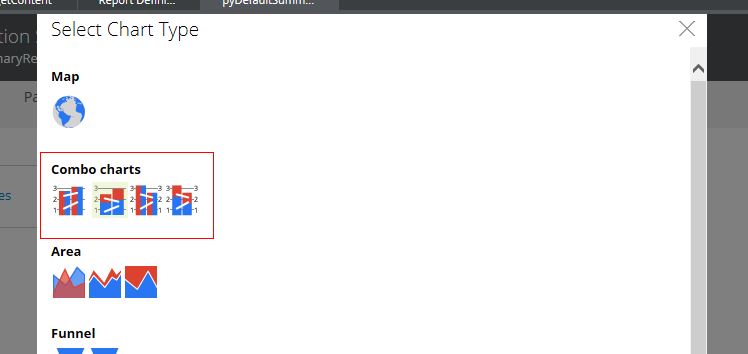
There are some specific "Combo charts" available in the Chart Editor. From the help page:
combo chart
A combo chart combines and displays the data from both a column chart and a line chart. A combo chart has either a single y axis (vertical), or two y-axes. The two data sets share the same x axis (horizontal).
You can specify the chart type and subtype for a report definition report by using the Chart Editor.
Other than these, I know of no way to combine arbitrary chart types.
Choosing "No limit" for the "Limit to top" value is the only auto-adjust setting. Otherwise, your only choices are 1-20 in the drop down.
The slider controls whatever group-by property you have put on the chart. It is basically used to focus in on a particular section of the chart (e.g., a certain subset of columns or bars).