Closed
Report Definition Chart showing differently in a section
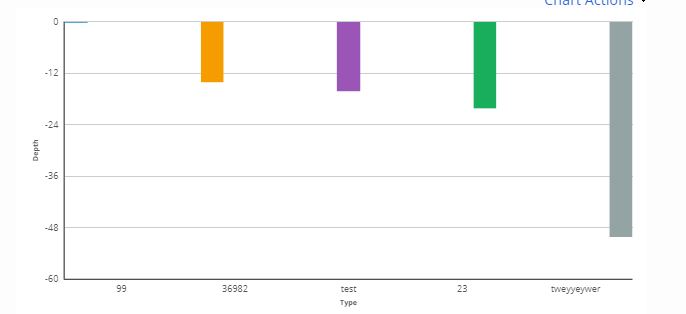
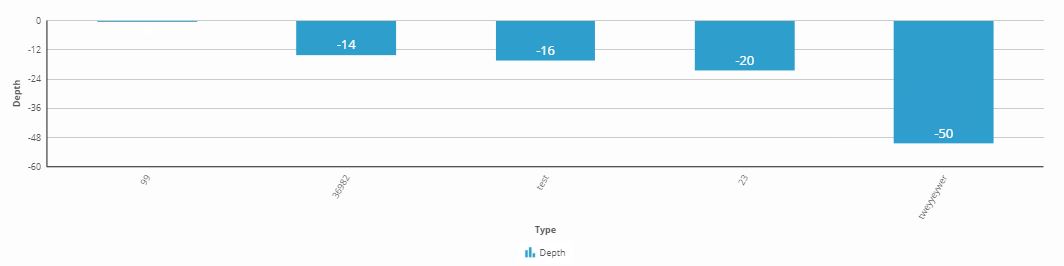
I am Adding a chart in a section, however the chart by running report definition and the one showing in the section are different. How can this be resolved?
Report Definition
Section
Posted: 3 years ago
Leaseplan digital
NL
The control used by the chart in report definition is "chart" and it makes use of all chart configuration made at report definition chart tab. In the section you using "pxChart" control and sourcing it with report definition. It does not make use of the chart configuration at the report definition level and needs to be configured separately. If both configuration matches chart will look alike.
Posted: 3 years ago
Evoke Technologies
IN
What configuration changes are required in the chart control? All I see in the presentations is to set colour based on values?