Closed
Time delay to see the dasahboard in portal
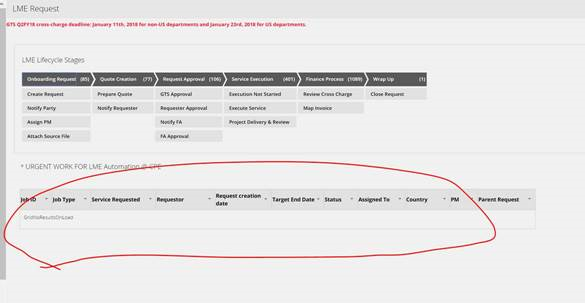
Dashboard takes a lot of time to load. Also the grid shows up empty sometimes and needs 2 to 3 times of refresh to populate the values.
Posted: 6 years ago
Verizon Data Services
IN
Hi ,
Try to get the performance profiler reading from from designer studio-system-performance while refreshing the dashboard. It could be because you db interaction is taking some time or because of some complicated logic while fetching the data . You can use defer load as well.
Posted: 6 years ago
Pegasystems Inc.
US
Generally to read the unexposed properties from the blob column, it might cause performance delay depends on the number of unexposed properties that are being used in the grid. You can try to expose those properties and check the difference in performance.