Question
Ernst and Young
IN
Last activity: 14 Jun 2021 7:38 EDT
Chart Configuration And Reporting
Hi All,
I want to configure a chart where the requirement is as below :
Sample Use Case : On X- axis I want to take Service Providers (eg : Service Provider 1 , Service Provider 2 ...) and on Y- axis I wnat to show number of cabs related to that Service Provider (100, 250 ...) such that user can see on graph that Service Provider 1 has 100 cabs.
Implemetation : I tried taking a data page as source where on X axis I am taking reference of property which is holding the service provider name and on Y axis I am taking the reference of Property which is holding the value of total number of Cabs. But I am not able to see the bars of different height as number of cabs(y-axis value is different).
Can you please help me here how to configure it such that on Y axis I can get the exact value of referred Property .
Thanks
Hari
***Edited by Moderator: Pallavi to move from Pega Academy to Product***
Updated: 14 Jun 2021 7:38 EDT
Pegasystems Inc.
IN
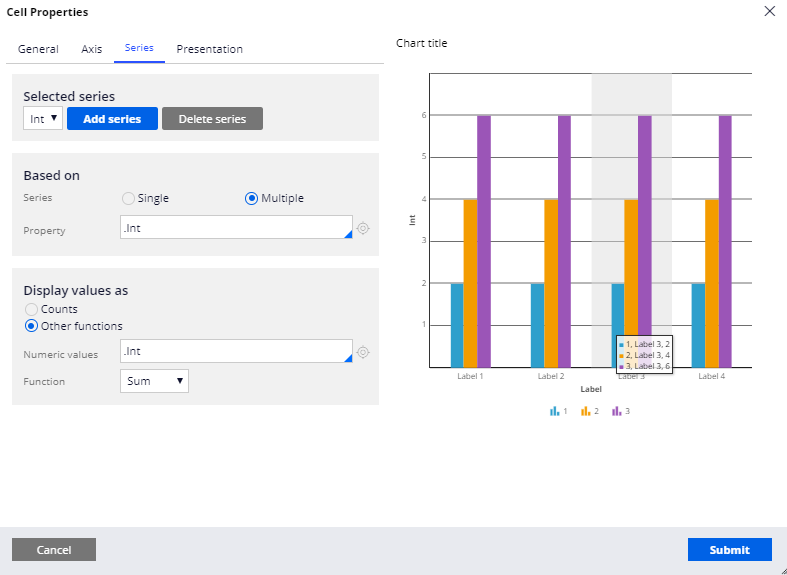
In the Cell properties of Chart control, in the Series tab change the Display value as other functions and mention the No of Cabs property there and use functions as Sum.
Please find the below screenshot for more details.